Community conversations
Using NLP to visualise conversations for the largest guardianship community in the UK.
CHALLENGE
To explore the relationships between the guardians, the property gaurdianship company and the building manager, highlighting the informal occupations of guardians, their work and life insecurity.
PROJECT
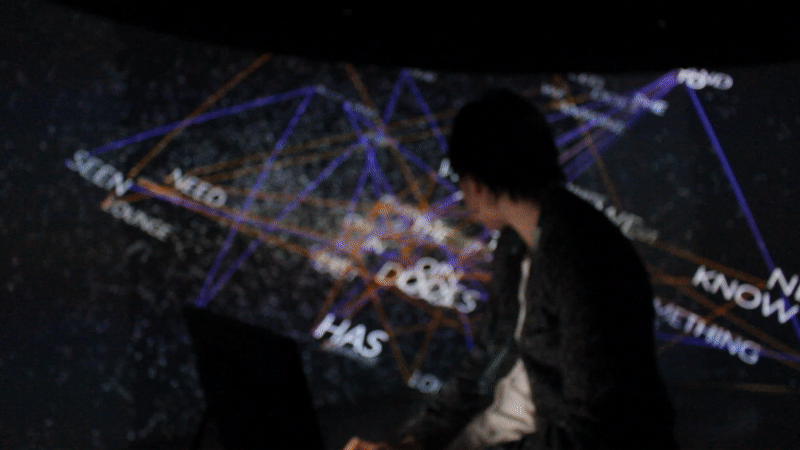
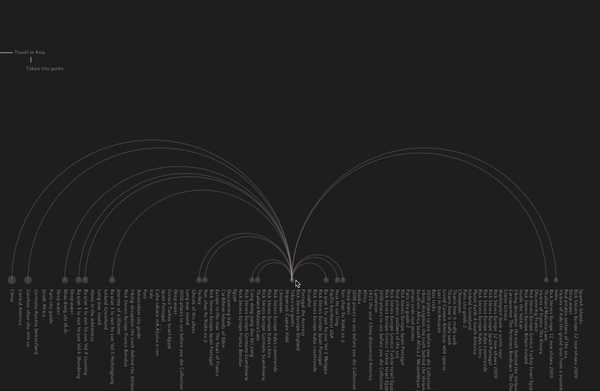
"Booth House is Typing…” is a visualisation that visually spatializes conversations from a group chat for a guardianship community in East London.
To explore the relationships between the guardians, the property gaurdianship company and the building manager, highlighting the informal occupations of guardians, their work and life insecurity.
PROJECT
"Booth House is Typing…” is a visualisation that visually spatializes conversations from a group chat for a guardianship community in East London.
Temporary property guardianship is a relatively new form of insecure urban dwelling existing in the grey area between informal occupation, the security industry and housing.
The guardianship (run by Dot Dot Dot property guardians) is the largest of its kind in the UK, and has 90 residents cohabiting in an informal housing arrangement. The community is characterised by a pooling of shared resources, and constant artistic collaboration between residents.
The visualisation attempts to capture the mutual participation of guardians in the process of creating, curating and distributing knowledge and resources.
The visualisation also hints at the complex power relationship between the guardians, Dot Dot Dot and the building manager, highlighting the grey areas between the informal occupations of guardians, their work and life insecurity.
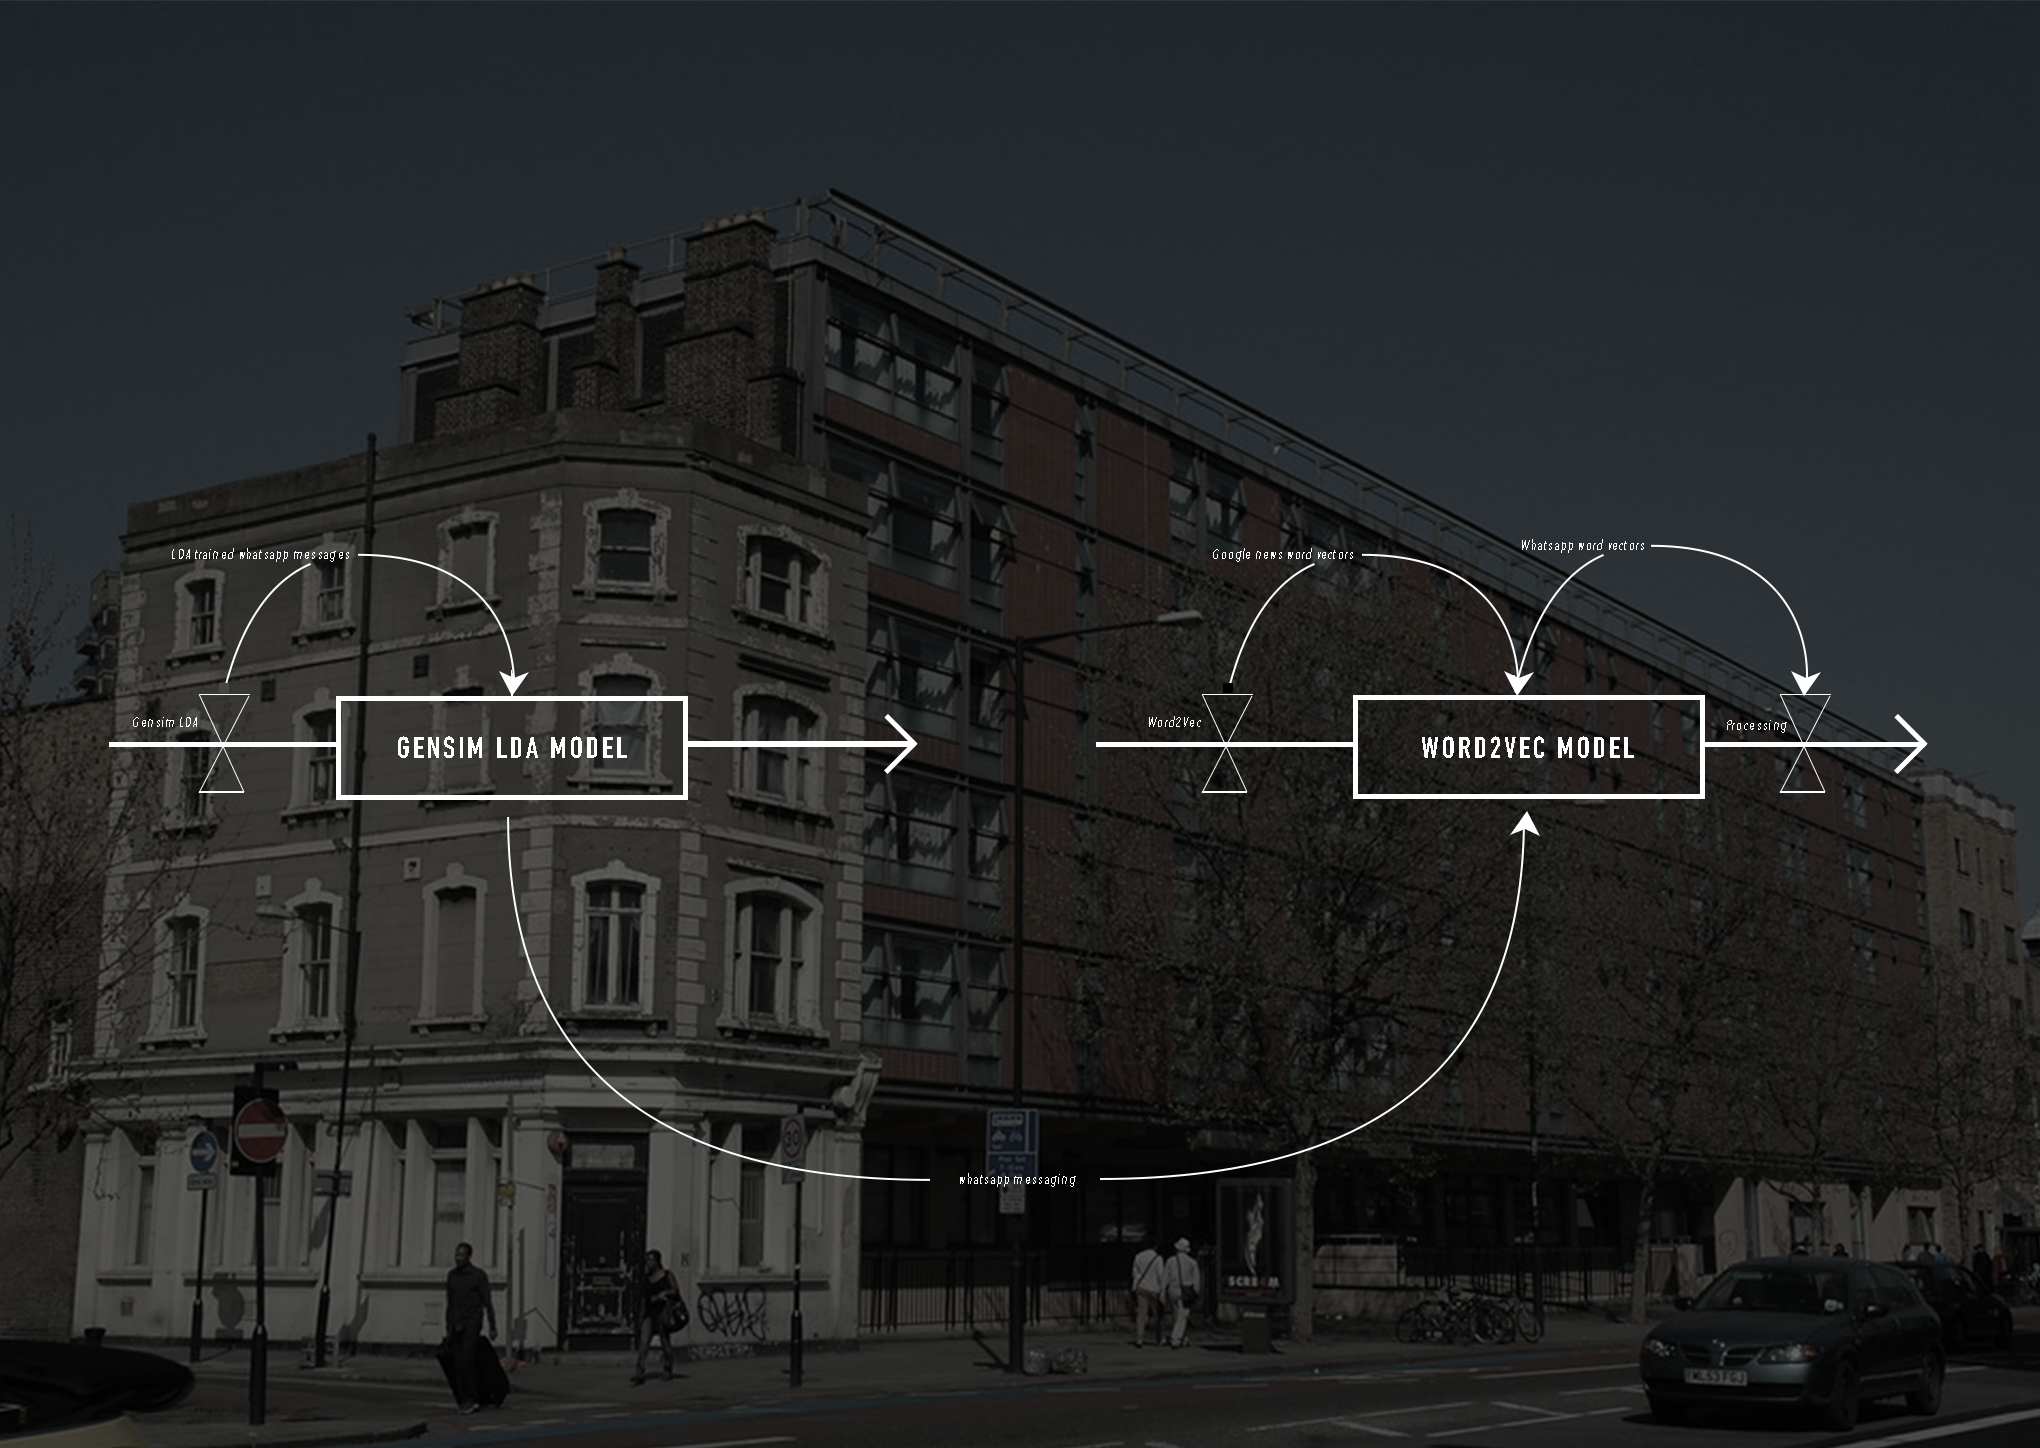
Process 1: Data Cleaning
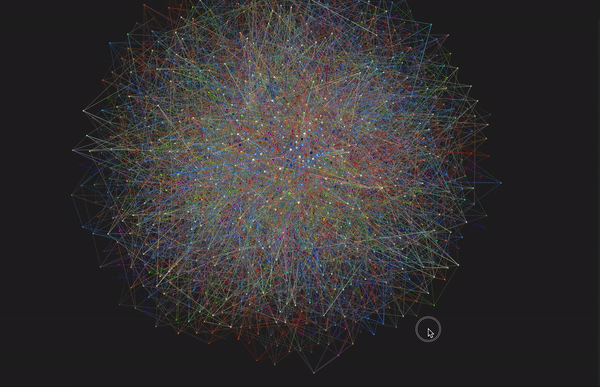
The data driven visualisation uses the guardianship-wide whatsapp group chat, pre-processes the conversation to remove mobile numbers and contact information. I ran the cleaned whatsapp data through two algorithms. The first generates topics of themes guardian’s mention in the group chat, such as alerts from Dot Dot Dot or events of interest. The second algorithm spatializes the messages as points in an n-dimensional vector space. Both the size and the darkness of the title dot represents how many conversation comments have the same topic vector. I then mapped the topic and message data and word embeddings in 3D space, and graphing the content of each message in the resulting word cloud.
Process 2: Interactivity
In terms of interactivity each topic is given a separate colour which can be turned on and off. The conversations can be viewed in Title Mode, where the vectors can be turned on and off. The word cloud can be used to see what conversations have topics that include the second word, the word topic information can be turned on and off. When a point is hovered over the words/titles appear, the user can use the up and down arrow keys to cycle through the words/titles. The right and left arrow keys can be used to select a specific word/title and see the connections related to it.
Process 3: Algorithms
The visualisation incorporates two natural language processing (NLP) algorithms, illustrating how machine learning algorithms can extract insights from textual data. Furthermore, the visual touches on Information privacy as the relationship between the collection and dissemination of data, technology, the public expectation of privacy, legal and political issues surrounding them. When considering underlying anxieties with ‘flexible living’ associated with the precarious lives of informal guardian communities, the debate around privacy, information exposure of the various practices of property guardians highlights the multiple levels of insecurity communities such as this face.
The code to run the visualisation locally is available on Github.
The project was exhibited at the Booth Haus art exhibition in December 2019
The project was exhibited at the Booth Haus art exhibition in December 2019